

Cruz-Pacheco G, Duran L, Esteva L, Minzoni AA, Lóp. Modelling of the influenza A(H1N1)v outbreak in Mexico City, April-May 2009, with control sanitary measures. Euro Surveill. 2009;14(26):pii=19254
Introduction
In this work we present an analysis based on theoretical considerations, with the aim of understanding quantitatively the effects of the sanitary controls and their relaxation on the evolution of the influenza A(H1N1)v outbreak in Mexico City in the period from April to May 2009. Since the only controllable parameter during an outbreak of this infectious disease is the contact rate, the World Health Organization (WHO) recommends reducing it by avoiding gatherings, closing schools, restaurants, cinemas, etc. These actions result in decreasing the maximum number of infected individuals, and the delay of the epidemic peak. We show that these sanitary measures, followed by a period with measures such as frequent hand washing and other prophylactic measures, can control the outbreak. Using this regime, our model is consistent with the currently available data. Finally, we present a less positive scenario which shows a second peak of the incidence curve after the return to school on 11 May, which might be seen in the real data, once the complete information on incident cases becomes available.
Methods
We used a simple model in terms of the number of parameters, the Kermack and McKendrick model [1,2]. The purpose of using such a simple model was to have a small number of parameters, first to give a rough estimate of the time of maximal prevalence, and second, to analyse the behaviour of the contact rate under the sanitary measures recommended by the WHO. It is generally accepted that the influenza A(H1N1) virus is transmitted by direct contact. There is no evidence that vaccination for seasonal influenza creates cross-immunity to influenza A(H1N1)v virus. Moreover, once the outbreak started there was some evidence of spatial homogeneity in the Mexico City area with cases being reported in different parts of the city. For these reasons, it was possible to use the Kermack and McKendrick model, without considering vaccination, in terms of the proportions
s(t)=S(t)/N, i(t)=I(t)/N, and r(t)=R(t)/N
of the total number of susceptible S(t), infected I(t), and removed R(t) individuals, where the total population N was assumed constant.
The equations for the time evolution of the epidemic outbreak take the form:
ds/dt = -βN s i,
di/dt = βN s i - a i,
dr/dt = a i.
Here, 1/a was the expected infectious period with an estimated value of 3 days, and βN was the contact rate which in this case controlled the reproduction number Ro. The initial conditions and the initial time for the applicability of the model were determined from the data on the onset of the epidemic (between 10 and 20 April) available from the Mexican Secretariat of Health (Secretaría de Salud de México) [3]. The control measures established on 23 April, changed the contact rate and their effects were modelled using a time-dependent contact rate. We calculated the prevalence and incidence curves integrating numerically these equations. The results were then used to assess the effect of the sanitary measures on the evolution of the epidemic. Finally, we comment that the delay due to the incubation period was not included because according to the Mexican Secretariat of Health, infected individuals become contagious soon after their infection, even before presenting symptoms.
Results
The basic reproductive number Ro=βN/a was estimated at the beginning of the outbreak using the force of infection and an exponential fitting of the data from the Mexican Secretariat of Health. We assume i(t)=exp(λt) at the onset of the epidemic, and substitute this expression in the equation for the infected proportion to obtain the relation Ro=1+λ/a, where λ is estimated fitting the data by least squares method. We used this approach to obtain Ro=1.72 for the outbreak in Mexico City. For the La Gloria community in the state of Veracruz, this same approach yielded an Ro of 1.716, which to two decimal places is the same as the Ro for Mexico City. This estimate is in good agreement with the results of Fraser et al. [4]. From this expression for Ro and from a=0.333, we obtained βN=0.57. This fit in addition gave the interval from 10 to 20 April as the possible time of onset. Moreover, assuming a population of 8x10⁶ individuals, we obtained from the fitting the estimate of 730 actually infected individuals for each reported case. Finally, using the estimated parameters, we calculated the numerical solution of the model and compared it with the observational data reported at the National System of Epidemic Surveillance of the Mexican Secretariat of Health [3].
In curve a) of Figure 1, we show the solution of the model starting at t=P0, which coincided well with the data from before the controls were started. When the control measures were implemented on 24 April, the Mexican Secretariat of Health reported that Ro was approximately equal to 1.3 [3]. With this value we estimated a contact rate βN of 0.44. Assuming this decay of the contact rate, curve b) shows the evolution of the epidemic as calculated from the model. We observed a substantial reduction of the maximal prevalence, at the expense of a delay of the maximum.
Figure 1. Modelling the evolution of the influenza A(H1N1)v outbreak in the metropolitan area of Mexico City, 17 April - 17 June 2009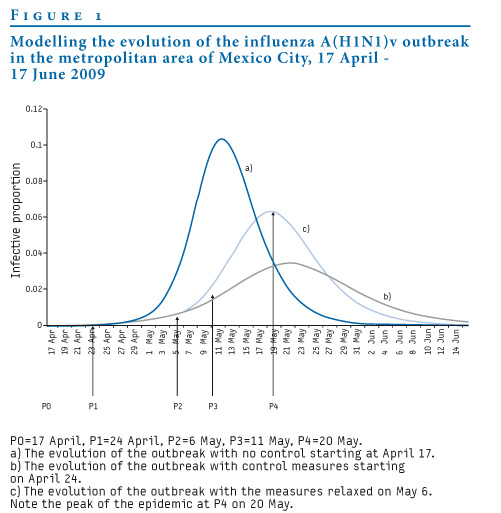
In order to have a preliminary estimate of the effect of the relaxation of the controls, we calculated the prevalence curve i (t). According to the model, a natural time to partially relax the controls would be close to the inflection point P2 of curve a), which corresponds to 6 May. Indeed, the health authorities announced relaxation of the measures near that date, on 1 May. At this date, the contact rate βN increased due to the continuation of normal activities. We assume that it increased from 0.44 to 0.5. We calculated the evolution of the epidemic shown in P3 of curve c). We observed an increase in the maximal prevalence, but no substantial change of the time of arrival of the peak compared to curve b). This calculation predicted the maximum prevalence at P4 on 20 May, which is the maximum of curve c) and corresponds to zero incidence. We remark that these calculations were available on 30 April and we assumed an instantaneous response of the contact rate for these preliminary estimations. Next, we examined in detail with the new available data how a more precise fitting of the model explains in simple terms the observed evolution of the epidemic.
To fit the evolution of the incidence we considered the data shown in Figure 2, and used the probable cases to determine the time evolution of the contact rate as a result of the controls. We start by remarking that when this work was under revision, the Mexican Secretariat of Health reported on 2 June 126 new cases in Mexico City without giving the dates of their occurrence; these cases were therefore not included in the calculations in the paper. Looking at the incidence data for the whole country for 26 May and 2 June, it is obvious that some cases take up to 30 days to be reported [3].
Figure 2. Incidence curve of the influenza A(H1N1)v outbreak in Mexico City, 17 April – 26 May 2009 (n= 6,114 probable cases and 1,752 confirmed cases)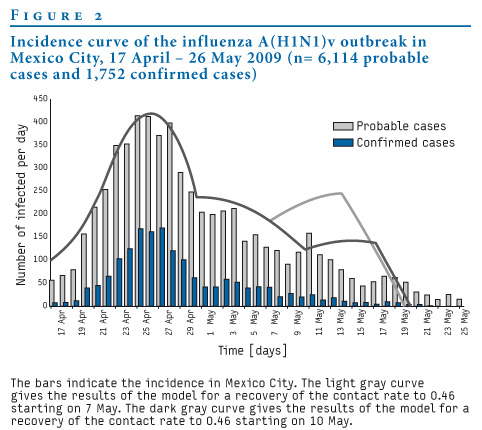
There is a clinical estimate of about five days as the relaxation time of the contact rate βN after sanitary measures are taken. We noticed that a better fit of the incidence data was obtained when a relaxation time of six days was used. We assumed a linear decrease of the contact rate βN between 24 and 30 April, from its original value 0.57 to 0.42. The latter value gave an Ro of 1.27 which was slightly below the value Ro=1.3 given by the Mexican Secretariat of Health. The contact rate βN=0.42 was kept constant for the rest of the period under sanitary measures. With these values, we obtained a good fit to the actual evolution of the epidemic up to 10 May. On 6 and 7 May, universities and senior high schools reopened in Mexico City. Elementary schools and junior high schools reopened on 11 May, but on 10 May was Mother´s Day and there was much activity in the city.
The data for May is still incomplete, therefore we present two possible scenarios. In Figure 2, the green curve shows a linear increase of the contact rate βN for six days, starting on 7 May, increasing to the value 0.46 and keeping this constant value until the incidence curve reaches zero on 20 May. The purple curve shows a linear increase of the contact rate for six days starting on 10 May, increasing to the value 0.46 and keeping this constant value until 20 May. The available data seem to indicate that the increase of the contact rate did not start until 10 May, suggesting that the reopening of universities and senior high schools in Mexico City did not have a big impact on the contact rate. However, as we remarked above, the data for this period are incomplete and therefore, we will only be able to see which scenario is more likely to have occurred once these data become available.
Finally, we note that the curves in the final phase are similar to straight lines and indicate 20 May as the time of zero incidence which corresponds to maximal prevalence. The straight line behaviour is due to the short duration of the peak as seen in the prevalence curves in Figure 1. We therefore propose a closer examination of the data, when available, to understand the duration of the peak in detail.
Figure 3 shows the reproductive ratio R(t) computed with the data from the Mexican Secretariat of Health shown in Figure 2 and using the method of Wallinga and Lipsitch [5] and the mean and standard deviation for the distribution intervals from Carrat et al. and Bo?lle et al. [6,7]. This ratio determines the current growth rate relative to its weighted average in the past. It reaches one at the maximum incidence.
Figure 3. Effective reproductive ratio R(t), influenza A(H1N1)v outbreak in Mexico City, 17 April – 21 May 2009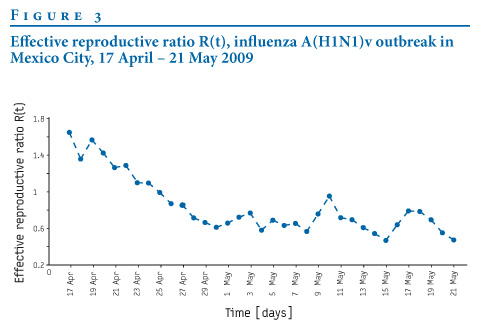
The reproductive ratio R(t) was >1 at the onset of the outbreak and decreased slowly until 7 May, crossing the value 1 on 25 April. This behaviour is consistent with the results shown in Figure 2, where the maximum incidence occurred on 26 April, which was the same day when R(t) was 1. After 26 April, both curves descended until 7 May. After this, R(t) showed larger oscillations, which are another indication of a change in the progression of the epidemic due to the relaxation of the sanitary measures. This is the region for which we give two possible scenarios. We observed that both methods complement very well each other.
Discussion
We have shown how a time dependent modification of a classical model can be used to make reliable predictions on the evolution of the influenza A(HIN1)v epidemic, using only preliminary estimates of the life time of the virus and the initial growth of the incidence curve at the onset of the outbreak. Usually, these are the only available data when an outbreak of a new virus starts. The effect of the sanitary measures was studied modelling the decrease and increase of the contact rate using linear functions of time. The fitting shows a time of relaxation of the contact rate of around six days. The model shows that the sanitary measures had a long lasting effect in that it kept the contact rate low in the period when these measures were in place. Once the sanitary measures were lifted, the contact rate remained much lower than at the onset of the outbreak. The use of antivirals as a prophylactic measure requires an independent study. However antiviral drugs were not used in Mexico during the outbreak.
The time scale of the response to controls and their relaxation show that the present model together with real-time monitoring of the incidence curve can provide reliable forecasts of the evolution of the outbreak, providing another tool for a decision regarding the epidemic alert level during a future outbreak.
Acknowledgments
The authors are grateful to Ana Cecilia Pérez and Ramiro Chávez for technical support. G. Cruz-Pacheco and L. Esteva were supported by grant IN108607-3 of PAPIIT-UNAM.
References
- Kermack WO, McKendrick AG. Contributions to the mathematical theory of epidemics. Proc. R. Soc. Lond. 1927;115:700-21.
- Murray JD. Mathematical Biology. Berlin: Springer; 1989. p.610-50.
- Situación actual de la epidemia. [Current situation of the epidemic]. Secretaría de Salud de México. 2009, May 29. [In Spanish]. Available from: http://portal.salud.gob.mx/descargas/pdf/influenza/situacion_actual_epidemia_290509.pdf
- Fraser C, Donnelly CA, Cauchemez S, Hanage WP, Van Kerkhove MD, Hollingsworth TD, et al. Pandemic potential of a strain of influenza A (H1N1): early findings. Science. 2009;324(5934):1557-61.
- Wallinga J, Lipsitch M. How generation intervals shape the relationship between growth rates and reproductive numbers. Proc Biol Sci. 2007;274(1609):599-604.
- Carrat F, Vergu E, Ferguson NM, Lemaitre M, Cauchemez S, Leach S, et al. Time lines of infection and disease in human influenza: a review of volunteer challenge studies. Am J Epidemiol. 2008;167(7):775-85.
- Bo?lle PY, Bernillon P, Desenclos JC. A preliminary estimation of the reproduction ratio for new influenza A(H1N1) from the outbreak in Mexico, March-April 2009. Euro Surveill. 2009;14(19): pii=19205.
See Also:
Latest articles in those days:
- The surveillance programme for avian influenza (AI) in Norwegian wildlife 2025 3 hours ago
- The surveillance programme for avian influenza (AI) in poultry in Norway 2025 3 hours ago
- Emergence of Novel Reassortant H3N2 Avian Influenza Viruses in Southern China: Genetic Complexity and Pathogenicity in Chickens and Mice 3 hours ago
- Pathological evidence of neurotropism and oculotropism in wild black-headed gulls naturally infected with H5N1 high pathogenicity avian influenza 4 hours ago
- Birth cohort effects in adults associated with influenza A(H1N1)pdm09 vaccine effectiveness 16 hours ago
[Go Top] [Close Window]